Are you new to the EXRO story? Read our introductory post here.
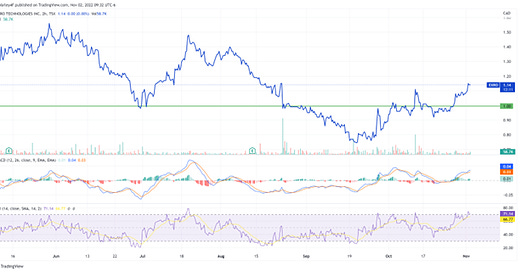
With the recent movement in EXRO its time to take a look at what the technical indicators are telling us. If you look at the trading in October you can see that the $1.00 price level had been a level of resistance in early October with a few head fakes where the price broke above $1 but subsequently settled below. As of last week EXRO has pushed above and sustained its price for several days in the range of $1.08-1.14 which is a positive sign for momentum. This can be confirmed by the move in the MACD seen in the first panel below the chart where the MACD line has crossed above the signal line and moved above the zero line. We are seeing that the RSI is indicating that EXRO is now in the overbought region so in the short term there could be some weakness but overall the momentum is encouraging especially when you compare it to the performance of the TSX over the last month (shown in the second chart). Look for the next technical resistance level at $1.60


